AHT - The "Untouchable" Service Metric
By Martin Bailey
Anyone who has worked in a “Call Centre” of the 80s through to what we now call “Service Centres”, would have seen an awful lot of change, but the one constant that has remained across most, if not all, of these centres is the performance metric of AHT (Average Handling Time). In layman’s terms, this is the average time spent servicing each call.
Associated with this metric is a huge debate around its place within a service operation, how AHT is used as a “management” metric and the negative behaviours that measurement and management of AHT encourages or propagates.
So, the big question is,
“How do you reduce AHT within service operations WITHOUT negatively impacting the customer experience, or driving the negative process behaviours associated to it?”
One simple answer is to look at Call Handling as just another process, and tackle that process with a Lean mindset of removing un-necessary activities from the call.
The Case Study I am going to present to you is based upon a project managed within two Service Centres of a large global blue chip organisation. Our baseline measures or indicatros of the current state of play were as follows:
- 80,000 inbound calls per week
- AHT across all teams 422 Seconds
- Service level (calls answered within 20 seconds) – less than 10%
- Overtime payments – significantly higher than previous quarter
Just like in this case study, many call / service centre operations calculate their resource requirements (how many bums on seats do I need over what time periods?) based upon the following:
Incoming Demand (Secs) = Volume of Calls X AHT
When the Incoming Demand is calculated then the headcount to meet that demand can be derived using the following calculation:
Number of FTE required = Incoming Demand (Hrs)
Average Hours per week per FTE (e.g, 37 Hrs)
So, as much as we would like to say that we don’t want to measure AHT as a performance indicator, it is a fundamental component of many service centre resource planning calculations. Based upon the above formulae, if the AHT Increases and the volume of calls stays the same, the Incoming demand time increases, and as this increases, then so does the FTE requirement to meet that demand.
1. Approach and Philosophies applied
One of the critical success factors for this project was that our objective WASN’T to reduce AHT or try to “Manage” it downwards. Instead, in conjunction with the Executive Sponsor we agreed that we would manage this project through a “Lean Lens” and approach it like any other Lean piece of work – by focusing on the process first and foremost. It was also agreed right at the start that the Lean approach would focus on three key principles.
1. Waste Removal
Review the processes in question (call handling), identify waste within those process (using the TIMWOODS waste categories) and remove those waste activities from the call
2. Standardisation
Once the wastes had been removed, develop the “best practice” and most efficient process flow and apply this standard work across the whole of the service operation
3. Workforce engagement
Integral to the approach taken was the agreement to set up a “Working Group” as a project team, comprising of internal staff from all the different areas within scope. The principles behind the use of internal staff to support the project were simple:
- If you want to know what REALLY goes on in a process, ask the people who ACTUALLY do the work – these are your real process experts
- If you want to know what will and won’t work out on the shop floor – ask the people who do the work
- If you want a solution to “stick” and become “Business As Usual”, get the people who do the work to help build the solution
- A cross functional team, with different views and opinions, will challenge each- others thinking and principles, but will ultimately come to a consensus and deliver a solution that works for everyone – first time.
- The formal meetings would focus on ideas generation and decision making
The Working Group met formally, on the same day and time of the week, every week, with additional actions to be completed outside of the meetings agreed.
If you wanted a perfect example of a Value-Added meeting then this would be it. The energy, drive and enthusiasm from each member made this hour very high energy, very productive with fantastic outcomes – that one hour used to fly by.
We now had a clear direction from our executive sponsor, we knew the approach we were going to take but there were just a few guidelines we wanted to follow:
- Quality and Customer Service should not deteriorate because of any improvement activity
- We would measure AHT but would not “manage” against it. If we were successful in removing waste from calls, the time spent on calls would reduce, which would result in a reduction in AHT.
- The waste would be removed from the internal process time, with no impact on the customer’s time on the call. There would be a clear focus on making the internal process more efficient and reducing the time the call agent spent on the phone.
See graphic below:
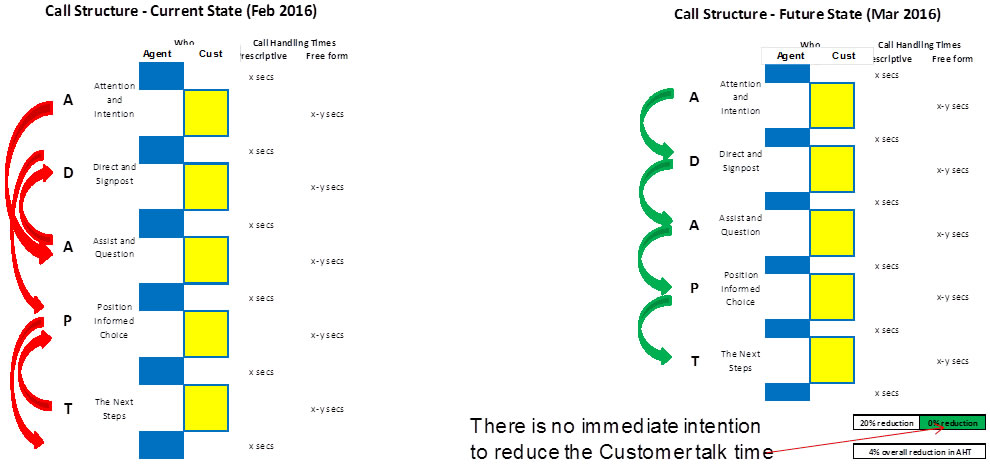
The graph on the left (red arrows) shows a process where call agents were moving up and down the process of questioning, with the time spent by the agent doing their activities highlighted in Blue.
The graph on the right (green arrows) shows a right first time questioning approach with smooth transition between stages, with the time spent by agents (blue blocks) now smaller in terms of time spent.
The time spent by the caller is identified in yellow in both graphics. And in both graphics, these blocks are the same. So there is no pressure on the call agent to “hurry the customer” up to reduce their AHT.
2. Making the Case for Process Improvement
Gemba – Data Capture Step 1
For manufacturing and other industries “going to the gemba” involves physically visiting and observing the process in action. In a call / service centre operation this means listening to live calls. We did this in two ways:
- Side by Side – Sitting with call agents as live calls come in. During the call you can document observations, opportunities and any questions you may have for the call agent for process clarification when the call is finished.
- Group Call Listening – Taking recorded calls and listening to them over speakers in a group environment. This allows debate and discussion about aspects of the call. From this process we were able to identify 15 separate opportunities for improvement that were deemed as “wastes” on the call.
Stakeholder Review
Once these 15 “wastes” were identified, the team spent time with their stakeholder peer groups and canvassed their opinions about the possibilities for removal of these 15 wastes. Feedback was extremely positive so we knew we had a high probability of success at implementation.
Activity Time Analysis – Data Capture Step 2
We now had 15 opportunities for stripping waste out of the calls that added absolutely no value to the customer, what we didn’t know was the size of the opportunity.
Our second phase of data capture involved listening to recorded calls on a sample basis to capture the specific activity time of each of the 15 opportunities.
We needed a way to sell the proposed improvements to the Executive Sponsor and their senior management team. A three-pronged approach was agreed by the team.
1. Data Interpretation
There was lots of information that needed to be presented in an impactful way. The good old fashioned “Blue Peter Barometer” approach was used with each waste activity and its associated activity time used to build a cumulative picture of the opportunity available. This accumulated opportunity was a total of up to 60 seconds that could be removed from a call.
2. Behavioural vs Process change - Standardisation
Some of the wastes were driven more by behavior than process variation, driven by some “bad habits” picked up over time. Although changing behavior isn’t easy, it’s much easier than trying to make changes to a legacy IT system.
There were pockets of “best practice” within the organization, where some call agents didn’t have some of these wastes within their calls, with no detriment to the customer experience. This set a precedent to standardization across the board.
3. Use what you have
A portion of the wastes on these calls was driven by the assumption that certain facts had to be “verbalised” during the call i.e, the agent had to say them on the call. Discussions with quality and risk departments led to an agreement that information could be provided to customers via other means.
This led to a significant increase in the use of both text messaging and email to provide customers with the information they needed, removing a significant amount of talk time from calls
Agreement was reached to proceed with the waste removal based upon the data presented.
1. Implementation
Approval from Senior Management obtained, we set about the implementation of our solutions across the board.
Having already spent a lot of time on stakeholder management, via the Working Group, there was a high level of acceptance of the upcoming changes from the call handlers themselves.
Communication was key to a successful implementation – documentation was punchy, factual and graphical
Trying to implement 15 changes in one go was going to be impossible, so a “phased” approach to implementation was agreed. The 15 opportunities were spread across 4 Phases of implementation, separated by two week intervals – so all 15 changes were communicated out to the business over a 6 week period.
2. Achieving Results
The success of this project was heavily dependent upon the “behavioural” aspects of change. To support these changes a high level of engagement with Front Line Managers, to ensure both effective communication and roll-out of the changes, took place.
Front Line Managers were asked to complete a weekly implementation status report for their individual teams, with implementation scored against the following criteria:
- Score of 1 – No communication out to team
- Score of 2 – Communication and roll-out completed
- Score of 3 – Changes in use and confirmed by Team Manager
This reporting not only allowed us to track the effectiveness of the implementation, but also generated a sense of competition between teams. This ensured an effective and timely roll-out.
The final outcomes of the project in terms of results were:
- AHT reduction of 37 Seconds – from 422 to 385
- This reduction generated additional capacity of 59 FTE within the operation
- This capacity was utilized to drive service levels up above 90%
Summary
- AHT reduction was achieved through removal of non-value added process activities
- Removing wastes shortened call, with a by-product of AHT reduction
- AHT was not “managed”
- Front line staff were heavily involved and engaged throughout the process
- The lean approach made sense to people
- Standardisation drives efficiency – significant gains were made just by getting everyone to follow a standard process.
About the author
Martin Bailey
Enjoyed reading these articles?
Have you got something you can share with the Network. Why not submit an article